BioTuner - Sound Matrix
Technical Aspects of Voice Analysis
The technology behind voice analysis is really quite amazing.
The voice is a difficult signal to analyze because it varies so much over time and is complex in nature. This is evidenced by the challenges scientists have been having in creating voice analysis software over the decades.
Technical Comparison of Two Voice Analysis Techniques
There are two main techniques for performing vocal frequency analysis for BioWaves Sound Therapy. Here we'll discuss the apparent advantages to the methods.
BioWaves offers products that use the two main types of analysis for health, "Bin" or Korg style analysis, and Fourier Transform analysis. Here, we'll share our experience highlighting the disadvantages and benefits of each.
Bin or Korg style Analysis
Bin analysis, or Korg style analysis is based on looking at the waveform for consistent, measurable "waves." When the detector measures a wave that meets the qualification criteria for consistency, frequency range, amplitude, etc., a "hit" is counted. The hit information is then categorized by incrementing a counter in the appropriate octave and note area. The Bin analysis, or Korg style analysis, is handled in our BioTuner Software.
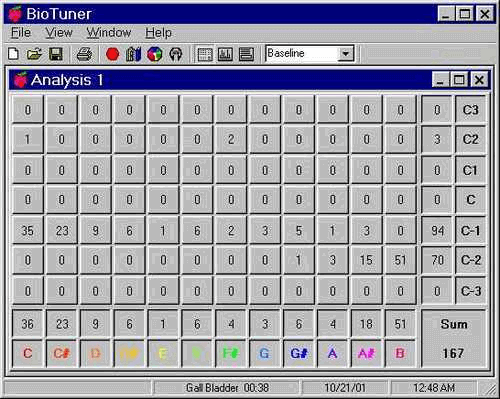
The key technical concept that defines one the most unique characteristics of Hit analysis is that it records events, and is not a measure of the energy level or amplitude produced at various frequencies. In other words, a loud sound is recorded as being exactly equal in importance as a quiet sound.
Lossyness
The Hit analysis system is also somewhat lossy, meaning that it doesn't record everything that is presented, only some. It's interesting to note that only one frequency is decoded at a time, meaning that if two equally important frequencies are sounded together, at most, only one of the frequencies will be recorded. It's usually the lower, louder sound that gets recorded. Because the lower louder sound is normally the one recorded, some people believe this makes the Hit detector a fundamental frequency detector. Further, it's important to remember that the Hit analysis system is lossy in that not all of the frequencies recorded will be detected.
The categorization procedure is critical attribute of the Hit analysis technique, but can be a little challenging to understand at first. What happens in Hit analysis, is that neighboring frequencies are cataloged together into bins, similar to the processing that occurs in a histogram. In other words, frequencies can and do vary continuously, but the analysis procedure "groups" similar frequencies together into a single result.
An example that may help explain this is to consider the process of graphing the height of a group of children. Each child is a certain height, say 48.32 inches or 51.72 inches. When graphing the results however, it is often most useful to combine the heights into bins, in this case each inch. So, all the students that were 48.00 to 48.99 inches would be counted in the 48-49 inch "bin." This binning of data is very useful, in that it combines the data in a statistical manner that makes it possible to display in an intuitive graph.
The BioTuner's ability to take measurements in real-time with the hit analysis technique is one of the main benefits of this technique. It makes it very useful for tracking what is going on with a client, both during the interview voice recording phase, and while tracking the client's response when they listen to BioWaves Balancing Sounds. To rephrase that last sentence, The real-time Hit analysis technique can provide an enlightening view into the effects of the frequencies as they are played back to a client.
During the interview process, the BioTuner software can often let the sound practitioner determine emotionally charged topics based on when a client hits notes that are normally deficient. For example, if a client is normally missing D, D#, and E, and then hits D, D#, and E exclusively when mentioning a certain subject, that's a good clue that the imbalance is related to the missing frequencies. The real-time aspect of the software lets the interviewer easily lead the conversation around certain subjects. This process is much more difficult to do in comprehensive systems, like the Fourier systems, where the recording is processed as a block.
Fourier Analysis
Fourier analysis is performed by taking the whole recording, and re-evaluating it mathematically to determine the energy present at various frequencies. Fourier analysis is included in two of our products currently, The Oneness Sound Assistant, and the Identi-Phi, which is available in two versions, the Identi-Phi DIGITAL and Identi-Phi CD.
In essence, Fourier analysis involves converting time domain waveform data into a frequency snapshot which displays the energy level existing at each frequency. Joseph Fourier, a French mathematician was responsible for developing the Fourier Analysis technique which is used throughout the world today. The Fourier analysis technique involves simply transforming the data from time domain to frequency domain. It is the same as looking at the waveform from a different viewpoint, like looking at a house from the above rather than from the street.
It is just a different view of the same data
The Fourier transform converts the data from a waveform view to a frequency view. Here is a picture of the time domain waveform data, which is simply a picture of sound amplitude over time.
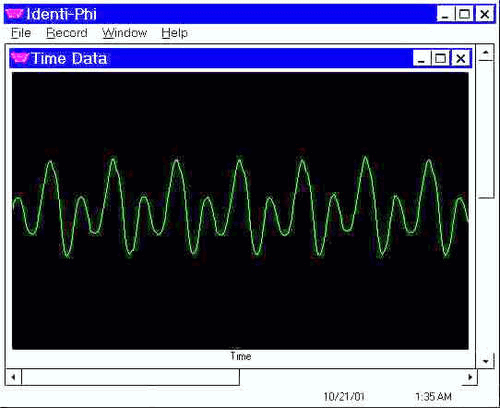
This is a screen shot from our real-time Fourier Analysis package called Identi-Phi, available in digital or CD format.
Both the time domain and frequency domain data sets represent exactly the same information, they just present the information in a different way. The time domain waveform shows you the amplitude or sound pressure on a microphone vs time, whereas the frequency view is represented by energy* vs frequency. (*Phase information is ignored.) Here is an example of a frequency domain graph.
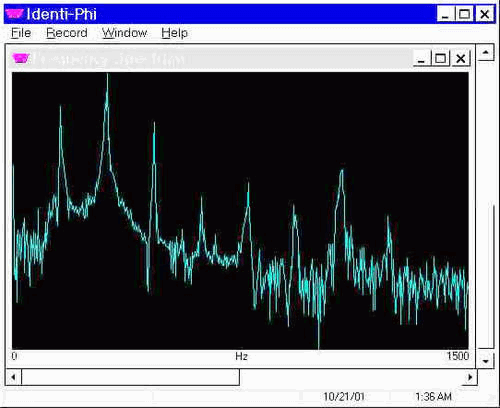
Regardless of which way you look at waveform data, it adds up to the same thing. It is rather like exchanging the coins in your pocket from 4 dimes and two nickels into 2 quarters... With both systems, you have the same core data "value", it just looks different.
With the fast technique of Fourier conversion currently used, some requirements and assumptions are made, and some waveform preprocessing is required. Although these assumptions are essentially true for our purpose, and the preprocessing is designed to NOT change the results, nothing is perfect, and artifacts can be seen. The techniques used are state-of-the-art, and we are working to improve them as more is learned about the process.
Working with blocks of data
The Fourier transform converts blocks of data from the waveform or time domain into the frequency domain. The length of the waveform data correlates with the level of detail obtained in the frequency domain. For more detailed information about the frequency contained in the waveform, a longer recording is required.
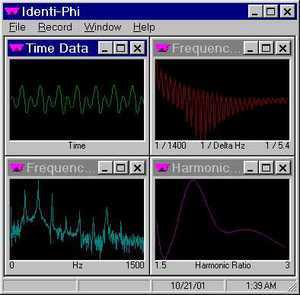
Once you have the frequency picture, it is essentially impossible to associate certain frequencies with the part of the time domain waveform. The transform loses all the time based information contained in the recording, and provides frequency information. It is possible to perform Fourier analysis on smaller sets of data, in other words with just short snip-its of the recording, so you would know what was being discussed, because it was all contained in a short segment of the recording. That's what was done in our Identi-Phi program that you see in the screen shots here. But, breaking the recording into many short frequency segments doesn't provide enough frequency resolution to be useful for health analysis. For the purpose of BioWaves Sound Therapy, a much longer block of data is required. The requirement to process the whole block of recorded data means that Fourier systems can not work in real-time.
The Fourier Transform is less statistical
Unlike the Hit analysis, where the hits are combined in a histogram in order to easily view the results, the Fourier technique use relatively little statistical processing. This lack of statistical processing, although good because it is much more sensitive to frequency issues, is much more prone to variation from recording to recording. This is due to several other reasons including sensitivity to what was being said in the recording, sensitivity to starting and ending points, sensitivity to clipped waveforms, etc.
Clipping
Clipping is a common problem associated with digitally recording sounds. When a waveform is converted from a sound pressure waveform into a computerized digital waveform, it must interface correctly. If the interface is too soft, the digital recording is too quiet. If the interface is too loud, the waveform "clips" or is truncated. It's like driving a car down a road with guardrails on both sides. If the interface is too quiet, the car ends up just going straight down the middle. When it's just right, the car will wave from side to side without ever hitting either guardrail. Clipping is when the car runs into the guardrail on either side, with predictable results.
In Fourier Analysis clipping heavily distorts the resultant frequency domain data, making it of somewhat questionable value. The Sound Assistant Software ensures that digital recording interface is set to an appropriate level to avoid both clipping and quiet waveforms. Most Hit analysis systems are insensitive to clipping, and some even purposefully clip the waveform to function.
In support of Fourier Analysis
Fourier analysis is currently the best technique for performing detailed frequency analysis of voice signals. It is non-lossy, meaning it will not ignore frequencies when another is present as with the Hit system, and is non-statistical in nature making it a much more sensitive instrument.
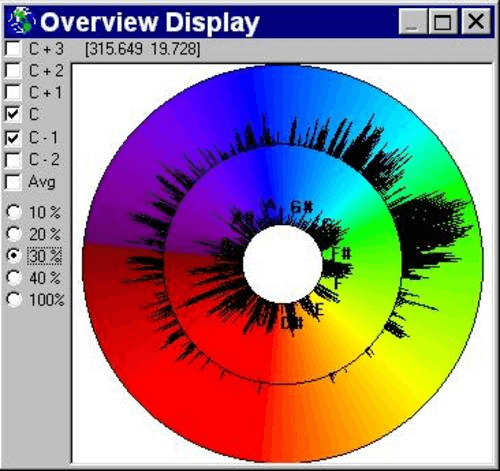
Here's a plot of the Fourier Transform in a circular format as found in our Sound Assistant Software:
Comparison Summary
| Hit Analysis | ||
| Pros | Real-Time Analysis | |
| High degree of consistency | ||
| Insensitive to Clipped Waveforms | ||
| Cons | Low frequency resolution, normally only 12 data points per octave. | |
| Statistical, Not a picture of voice energy | ||
| Lossy, in that not all frequencies are detected | ||
| Fourier Transform Analysis | ||
| Pros | Very high frequency resolution | |
| Very detailed energy picture | ||
| Non-Lossy | ||
| Cons | Non Real-time analysis | |
| High degree of inconsistency | ||
| Algorithm requires some manipulation of the data | ||
| Very sensitive to clipped waveforms |